

Header Line 1
Header Line 2
Header Line 3
Header Line 4
Header Line 5
Header Line 6
id,station,x,y,MinDepth,MaxDepth,date,Sampletype,totalwgt,numsieves,-6.25,-6.0,-5.0,-4.0,-3.0,-2.25,-2.00,-1.75,-
1.5,-1.25,-1.00,-0.75,-0.50,-
0.25,0.00,0.25,0.5,0.75,1.00,1.25,1.50,1.75,2.00,2.25,2.5,2.75,3.00,3.25,3.50,3.75,4.00,4.25
SHI001,CHA1
,1406034.39,248392.072,0.0,0.2,19980720,GRAB,23.909,27,999.,999.,999.,999.,999.,.000,.116,.001,.063,.004,.00
6,.008,.075,.158,.337,1.123,1.630,3.187,6.387,6.970,
2.053,1.187,.431,.128,.041,.014,.002,.000,.000,.002,.000,.000
SHI002,CHA2
,1405546.26,248390.668,0.0,0.2,19980720,GRAB,20.818,27,999.,999.,999.,999.,999.,.000,.002,.000,.000,.001,.01
0,.017,.040,.037,.079,.222,.285,.684,2.270,6.084, 4.821,4.304,1.495,.343,.091,.035,.014,.013,.018,.013,.000,.000
Plotting Frequency Weight Percent for PHI Sediment data
To plot the frequency weight percent, have the Sediment
sample theme active and the specific desired samples selected.
Click on the Grain Size Frequency Analysis button (Figure 6-
2). An option choice menu will be displayed; choose Plot
Frequency Weight Histogram (Figure 6-3). In addition to
Figure 6-2. Grain size
the plan view currently displayed, a Sediment Sample
frequency analysis
Percent Histogram view with the Sediment samples plotted
button
and a table will be opened. All three of the displays will be
interconnected such that any selectio n in one window will be reflected in the other
two. There is not a limit to the number of desired samples plotted at one time.
Plotting Cumulative Frequency Weight Percent for PHI
Sediment data
To plot cumulative frequency
weight percent, have the Sediment
sample theme active and the specific
desired samples selected. Click on
the Grain Size Frequency Analysis
button (Figure 6-2). An option
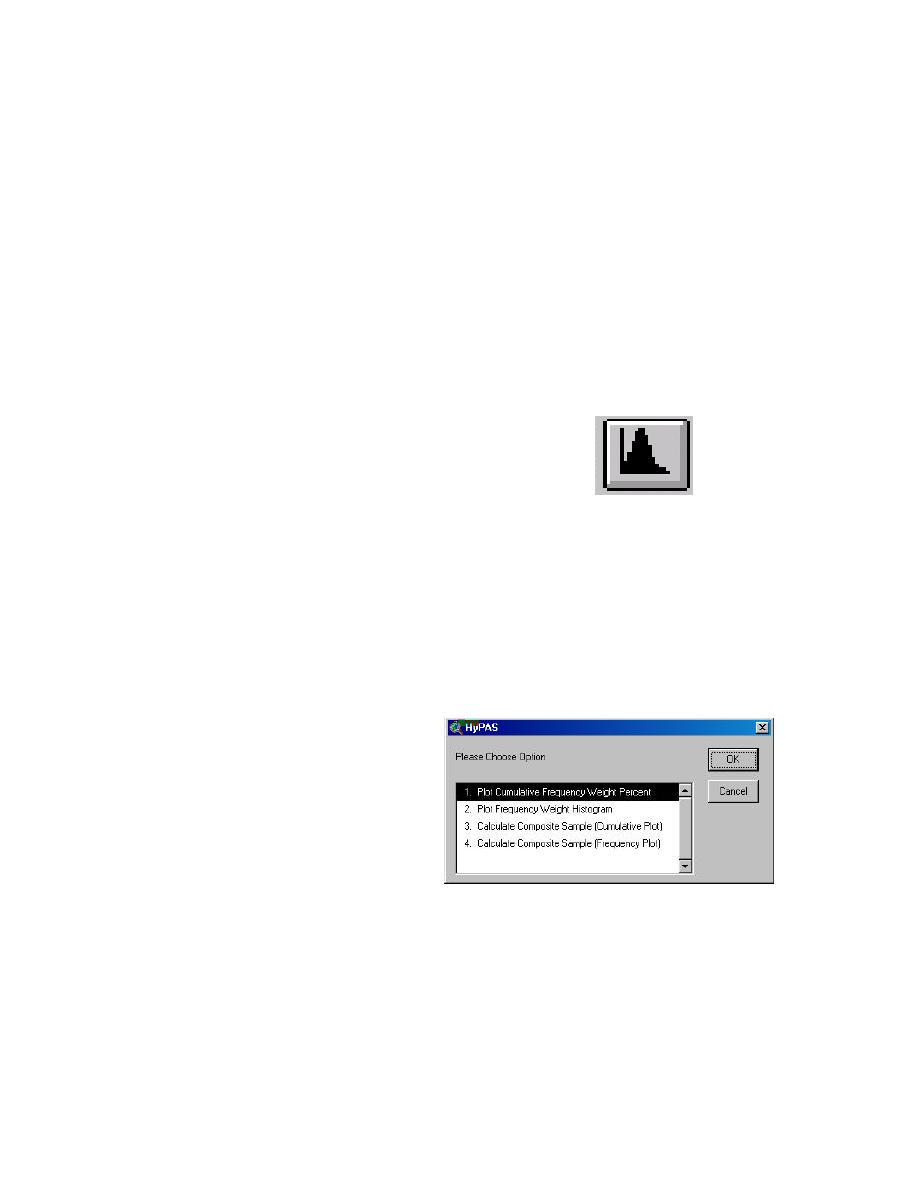
choice menu will be displayed;
choose Plot Cumulative Frequency
Weight Percent (Figure 6-3). The
user is prompted to select the type of
Figure 6-3. Menu for output plot type
y-axis (Figure 6-4). Choose the
desired y-axis and click OK. In addition to the plan view currently displayed, a
Cumulative Probability Sediment Sample Percent Plots view with the Sediment
samples plotted and a table will be opened.
All three of the displays will be interconnected such that any selection in one
window will be reflected in the other two. There is not a limit to the number of
desired samples plotted at one time.
6-2
Chapter 6 Sediment Sample Analysis

 Previous Page
