W. Huang et al. / Ocean Engineering 30 (2003) 22752295
2288
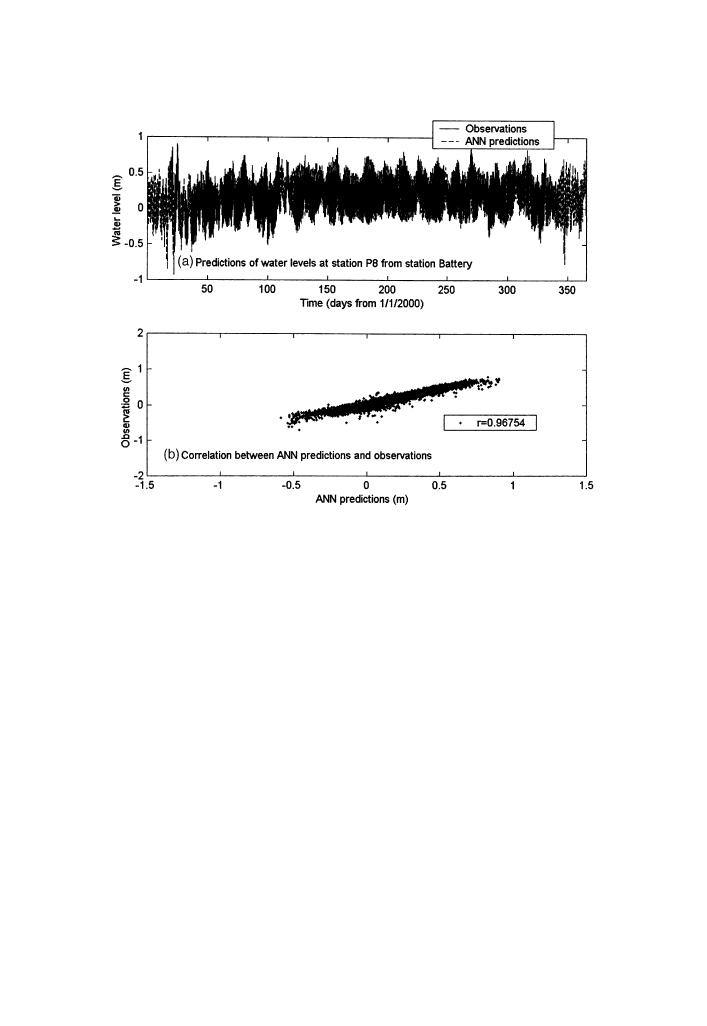
Fig. 9. Comparison of water levels between model predictions and observations at station P8 Fire Island
Inlet for year 2000. The distance between input NOAA station at Battery and the local station is about
90 km.
period should provide confidence in the RNN--WL neural network model's ability
to hindcast other periods when historic data is not available.
6. Model testing for subtidal water level predictions
Unlike periodic tidal fluctuations caused by astronomical forcing, subtidal sea level
variations are non-periodic signals induced by atmospheric pressure and remote wind
forcing. Wong and Wilson's (1984) study using 30-day data indicated that subtidal
sea level fluctuations along the Long Island South Shore were forced primarily by
longshore winds through coastal Ekman effects. Time series of water levels in Figs.
Because patterns of non-periodic signals are difficult to visually observe, there may
be some concerns about the capability of neural network models to recognize the
patterns in subtidal sea level fluctuations when new data sets are presented. In this
study, subtidal sea level variations obtained using 36-h low-pass filtering were used
to examine the neural network model's predictions of non-tidal water level variations.
Comparisons of model predictions and observations of time series subtidal sea


 Previous Page
