W. Huang et al. / Ocean Engineering 30 (2003) 22752295
2289
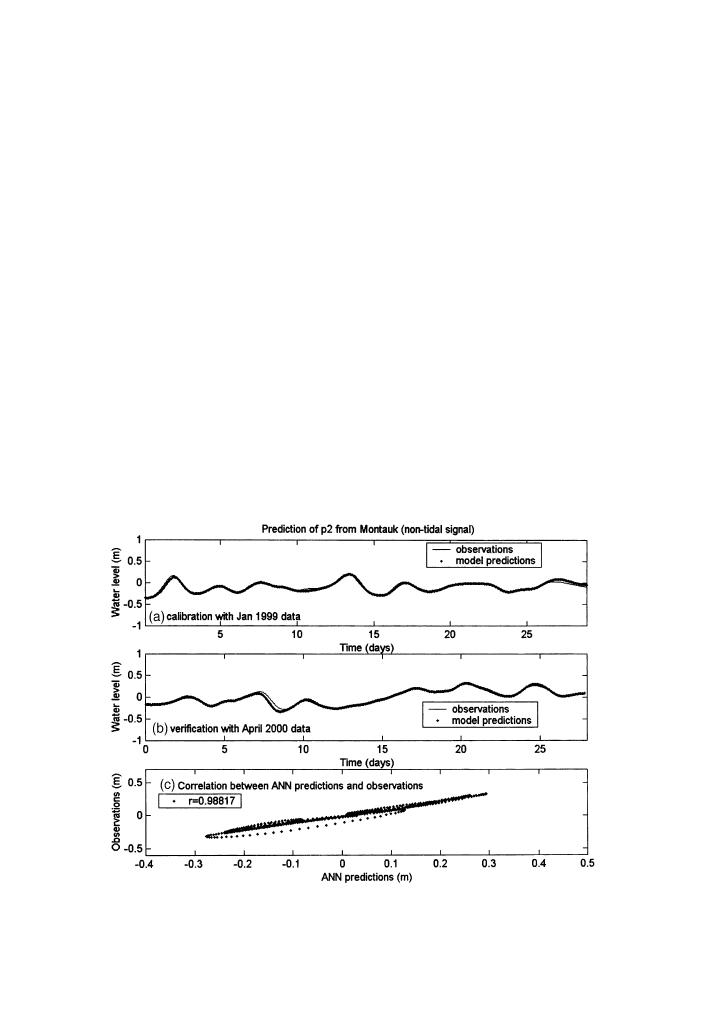
level variation are given in Fig. 10 for Station P2, and Fig. 11 for station P8. The
model predictions match well with observations and are able to reproduce the nonlin-
ear and non-periodic characteristics such as the magnitudes and phases. A summary
of the comparison statistics is given in Table 4. The correlation between model
predictions and observations is very high. The correlation values are 0.99 at Station
P2, 0.98 at Station P6, and 0.98 at Station P8, respectively. The RMSE error is 0.028
at Station P2, 0.027 at Station P6, and 0.017 at Station P8, respectively.
7. Model testing using water levels from remote NOAA stations
As described above, the RNN--WL model provides very good predictions of
water levels in a local station when inputs of water levels is given in a NOAA station
within about 100 km of the region of Long Island south shore. However, in some
other coastal study sites, the distance between a local station and a NOAA station
may be longer than 100 km. Therefore, the RNN--WL model would be more con-
vincing if it was further validated using inputs of water levels from remote NOAA
stations located over several hundred kilometers from the local station.
Three NOAA stations (NOAA Water Level Network Web Site) distributed in New
Jersey, Virginia, and North Carolina as given in Fig. 12 were selected to validate
the model performance using remote water level inputs. Among these three stations,
Fig. 10. Model test for non-tidal water level predictions at station P2. The distance between input NOAA
station at Montauk and the inlet is about 60 km.


 Previous Page
