

L. Erikson et al. / Coastal Engineering 52 (2005) 285302
293
Table 1
seen or extracted when specified energy components
Summary of experimental conditions
are filtered out. The power spectrums of each are
Case
T
fm
H0/L0
Foreshore
Surf similarity,
H0
shown in the lower plots of the figure and indicate
slope (tanb)
n
(s)
(Hz)
(m)
that for the first wave train, the majority of the
C1
1.7
0.06
0.18
0.040
0.20
0.130.80
energy is concentrated around 0.13 Hz. For the
B8
1.3
0.08
0.13
0.049
0.07
0.170.99
second wave train, most of the energy is concen-
B9
1.3
0.08
0.18
0.068
0.07
0.111.08
trated around 0.15 Hz but there is also significant
B10
2.2
0.05
0.13
0.017
0.07
0.301.63
energy in the lower and greater frequencies up to
about 0.25 Hz. Based on similar analyses of several
wave trains and a comprehensive literature review it
seems that the majority of significant energy for
typical vessel generated wave trains lies below 0.25
about 50 to 300 s was generated by a high-speed
Hz (i.e., greater than 4 s).
vessel while the surface elevations from about 650 s
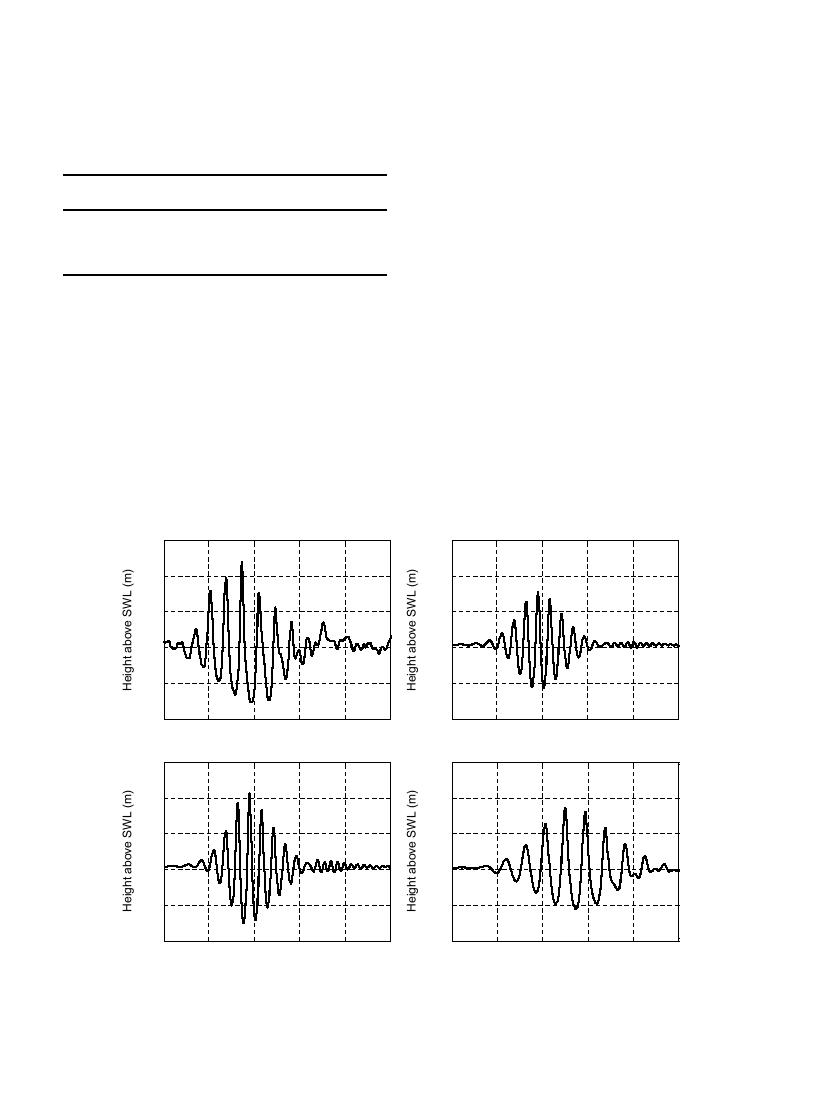
The idealized wave packets employed in the
onward are from a conventional displacement vessel.
experiment consisted of wave trains with increasing
The initial decline of the water surface (from 700 s
and subsequently decreasing wave heights and
to 750 s) is due to the displacement of the ship and
individual wave periods from 4.1 s to 7 s. The
is not considered in this study. Note however that the
upper limit was set to avoid spurious wave gen-
shorter waves of both wave trains are quite similar in
eration in the small wave tank. A time-scale factor of
that they increase in height and subsequently
1:3.16 (corresponding to a length-scale factor of
decrease. This is quite typical and can be readily
0.15
0.15
0.1
0.1
C1
B8
0.05
0.05
0
0
-0.05
-0.05
-0.1
-0.1
125
130
135
140
145
150
675
680
685
690
695
700
Time (s)
Time (s)
0.15
0.15
B10
0.1
0.1
B9
0.05
0.05
0
0
-0.05
-0.05
-0.1
-0.1
675
680
685
690
695
700
700
705
710
715
720
725
Time (s)
Time (s)
Fig. 5. Offshore wave trains measured approximately 14 m from SWS.

 Previous Page
