L. Erikson et al. / Coastal Engineering 52 (2005) 285302
295
0.042
0.6
0.6
0.12
0.035
0.5
0.5
0.1
B8
C1
0.4
0.028
0.4
0.08
0.3
0.021
0.3
0.06
0.2
0.014
0.2
0.04
0.007
0.1
0.1
0.02
0
0
0
0
0
2
4
6
8
10
12
14
16
0
2
4
6
8
10
12
14
16
Time (s)
Time (s)
0.07
0.056
1
0.8
0.7
B9
0.8
0.056
0.042
0.6
B10
0.5
0.6
0.042
0.028
0.4
0.4
0.028
0.3
0.2
0.014
0.2
0.014
0.1
0
0
0
0
2
4
6
8
10
12
14
16
0
2
4
6
8
10
12
14
16
Time (s)
Time (s)
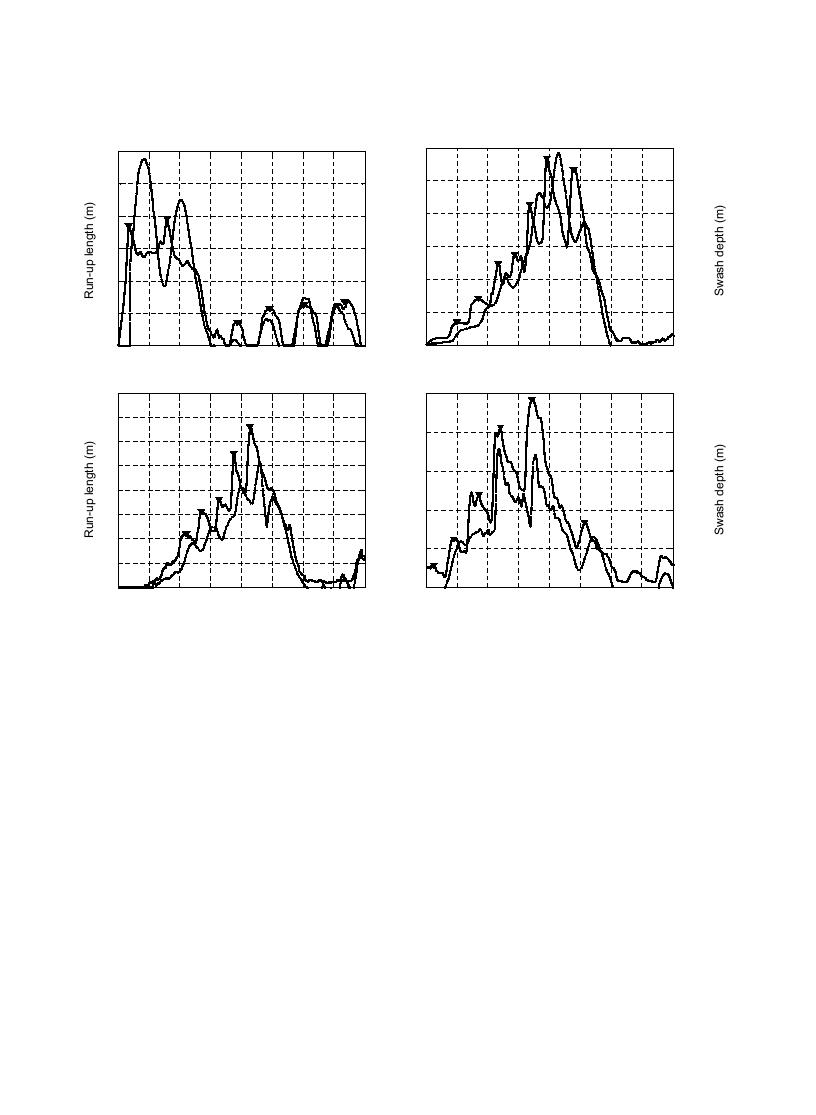
Fig. 6. Measured run-up lengths (dashed lines) and swash depths at the initial still water shoreline (solid lines). Bore heights and arrival times
input to model are shown with downward pointing triangles. (N.B. Vertical scale differs between panels).
maximum run-up heights are substantially different
depth precedes the variation of the run-up. This is
for cases B8 through B10 depending on whether
important as the measurements taken at the SWS
swash interaction is accounted for or not, the vertical
contain some part of the run-up signal due to the
scales in Figs. 9 and 10 are not consistent for a given
backwater returning to the SWS. It is also apparent
case. If the vertical scales were the same, much detail
from the peaks of the curves, shown with the solid
between measured and calculated run-up lengths
circles on the inset of the figure, that there is a phase
would not be visible in Fig. 9. Inputs to the model
shift of less than half a second between the run-up and
are bore heights and their arrival time at the SWS. The
swash depth at the SWS. Furthermore, there is a
bore heights and arrival times at the SWS are taken at
negative correlation between the phase shift and
the peaks of the time series in Fig. 6 as depicted by the
incident wave period so that the greater the incident
downward facing triangles. Up-rush leading edge
wave period, the shorter the phase lag.
heights (yhu) were estimated by iteration of the
5.2. Modeled run-up
empirical equation presented by Hughes (Eqs. (19)
and (20), 1992):
In Fig. 9, measured run-up lengths are compared to
yhu h4zm
14
s
run-up lengths calculated with the model described in
2
where h*=0.210.48x*+0.32x* and x* is the dimen-
Section 3. Model results without accounting for swash
s
interaction are shown in Fig. 10. Because the
sionless distance from the initial shoreline position to


 Previous Page
