

L. Erikson et al. / Coastal Engineering 52 (2005) 285302
297
1.00
root-mean-square error (rmse) is a measure of the
average absolute difference between observed and
0.98
calculated values and may be used to asses the
0.96
accuracy of the model. Smaller rmse values indicate
0.94
1.0
a better fit, and thus suggest that the model performs
0.92
better with the inclusion of the swash interaction
0.9
module, particularly for the cases with tanb=0.07. For
0.90
0.8
case C1, there is not much improvement when swash
0.00
0.20
0.40
0.60
0.80
1.00
interaction is accounted for in the model supporting
0.7
the notion that swash interaction becomes increas-
0.6
ingly important as the foreshore slope decreases.
In all cases except C1, Shield's parameter (Eq. (9))
0.5
was less than the critical value 0.8, (Wilson, 1989) for
0.4
sheet flow so that the clear-fluid friction factor
(Eq. (7)) was used, resulting in a value of
0.3
C1
0.0050 V fu V 0.0059 and 0.0053 V fb V 0.0072 with 2
B8
0.2
B9
cm V yhu V 4 cm and 1 cm V yhb V 3 cm. Simulations
B10
0.1
for case C1, with the steeper foreshore, resulted in a
Shield's parameter in excess of 0.8 for the first two
0.0
peaks. The sediment-laden friction factor (Eq. (8))
0
1
2
3
4
5
was calculated to be 0.0063 for both up-rush events
Time delay (s)
and 0.0071 and 0.0073 for the back-wash of the first
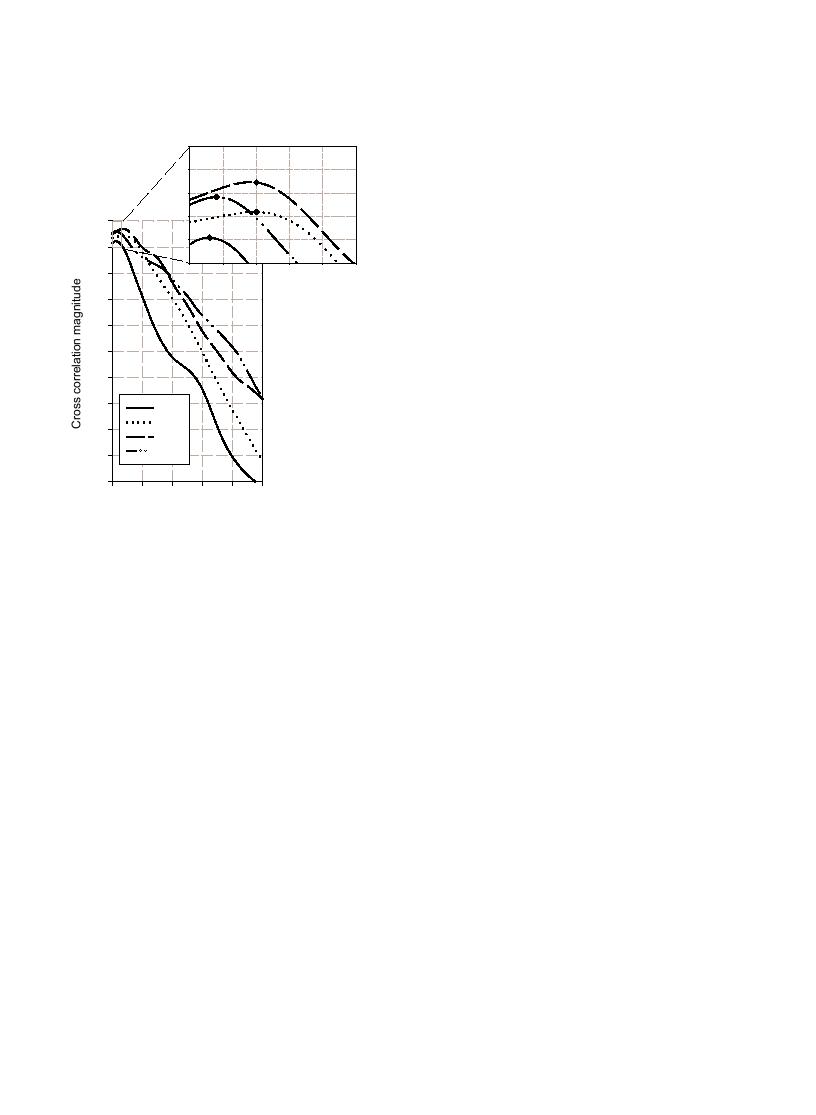
Fig. 8. Cross-correlation between measured swash depth at the still
and second waves, respectively (uniform sands were
water shoreline and run-up lengths for different experimental cases.
used in the experiment and so the approximation
D 90cD 50=0.13 mm was made). The calculated
friction values are on the lower end of what Puleo
Comparisons of model results to measured values
and Holland (2001) calculated. There was little
are listed in Table 2. The second column lists the
sediment transport observed during the experiment,
measured maximum run-up length, xmm, of each case
supporting the use of the clear-fluid friction factor for
while columns 3 and 6 list the calculated maximum
run-up lengths, xmc. With the exception of case C1
most of the time. It should be noted, however, that the
(tanb=0.2), the model without swash interaction over-
Shield's parameter commonly exceeds 0.8 in field
predicts the maximum run-up length. The largest
studies and that sheet flow has been observed during
much of the swash cycle, predominantly during the
difference between measured and predicted maximum
up-rush (e.g., Hughes, 1995).
run-up lengths obtained with the model including
swash interaction is 7% for case B10, while the
model gave best results with fu=0.01 and fb=0.04 with
predicted maximum run-up length was more than
doubled for the same case when the model without
respect to the minimum overall error between
swash interaction was employed.
calculated and measured swash trajectories. These
The overall shape of the shoreline motion, partic-
constant values were input to the model. Simulation
ularly in the beginning stage, is better represented
results showed little change of the overall shape of the
without swash interaction. This is true for all cases
trajectories and only marginally reduced the maxi-
with tanb=0.07 where the predicted run-up lengths of
mum run-up length. This was true for both cases with
the first bores are overestimated. This is likely due to
and without swash interaction.
some other mechanism not accounted for at the SWS
In order to highlight the effect of including swash
in the simple model presented here. Although the
interaction in the model, predicted excursion lengths
model does not perform better at the initial stages of
of individual bores for case B10 are plotted with
the shoreline motion, the maximum run-up and
solid lines in Fig. 12. The superposition of the
overall shape thereafter is well represented. The
parabolas is highlighted with the thicker solid line

 Previous Page
