

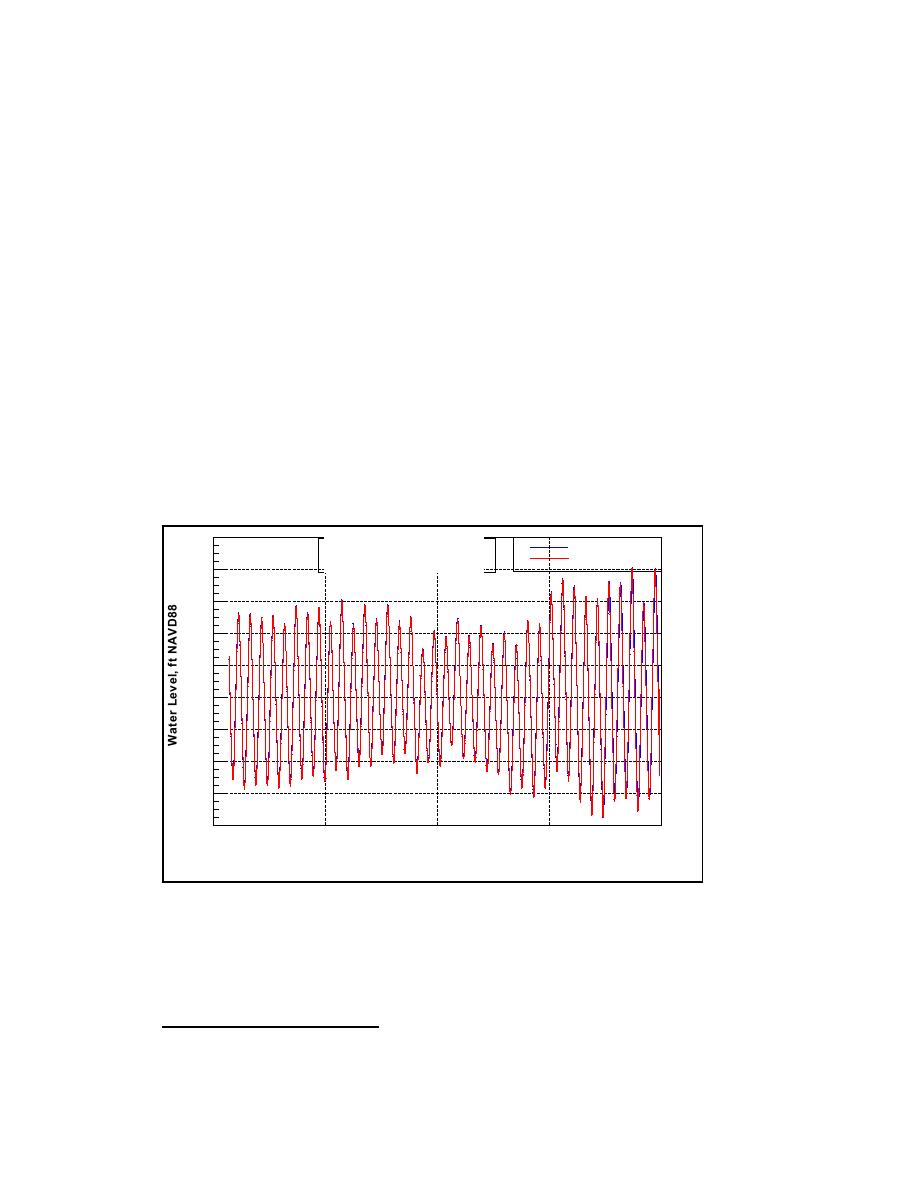
(Daylight Savings Time) by 4 hr. Figure 3-23b shows water levels for 5-7 October 2002,
during spring tide. The distance between Tide Gauge 1 and Tide Gauge 2 is
approximately 5,200 ft. Measured tidal ranges varied from 3.8 to 7.2 ft (at both
locations). The mean tide range offshore for the deployment was calculated to be 5.21 ft,
and the mean tide range in Mattituck Creek was calculated to be 5.26 ft. A 1-day spring
tidal range of approximately 6 ft was observed at both locations. Offshore at Mattituck
Inlet, the duration of the average ebb tide (defined as peak to trough) of record was 6 hr,
5 min, and the duration of the average flood tide (trough to peak) was 6 hr, 19 min. In
Mattituck Creek, the duration of the average ebb tide of record was 6 hr, 13 min and the
duration of the average flood tide was 6 hr 10 min. Signell et al. (2000) found that the
duration of the ebb tide in the eastern portion of Long Island Sound is 15 min longer than
the duration of the flood tide in that water body. The reversal to slightly longer flood tide
than ebb in the inlet is attributed to generation of overtides and other nonlinearities as the
tidal wave propagates into shallow water.
The measured mean tide range and spring tide range are consistent with those
range in the inlet as compared to the offshore, attributed to tidal wave shoaling in shallow
water and slight resonance in the enclosed channel system.
5
Mattituck Jetty and
Mattituck Jetty
Mattituck Creek
Mattituck Creek Water Level
4
3
2
1
0
-1
-2
-3
-4
9/19
9/24
9/29
10/4
10/9
September 2002 - October 2002 GMT
Figure 3-23a. Mattituck Inlet water level, 19 September 8 October 2002
1
At the Mattituck Inlet, NY, NOS subordinate station, NOS lists 5.4 ft as mean tide range and 6.2 ft as
spring tide range for Mattituck Inlet.
66
Chapter 3 Field Data Collection and Analysis

 Previous Page
