S.A. Hughes / Coastal Engineering 51 (2004) 10851104
1097
calculated wave momentum flux parameter as shown
for all nonbreaking and breaking waves, are shown on
on Fig. 7. Ahrens' data exhibited two distinct trends
that seemed to be delineated by a value of local
are given as.
spectral steepness corresponding to Hmo/Lp=0.0225
Nonbreaking/surging/collapsing waves (H mo/
regardless of structure slope over the range of tested
Lpb0.0225):
slopes. This steepness value appears to represent
!1=2
M
transition of breaker type from nonbreaking/surging/
Ru2%
F
1:3cotaŠ
1:75 1 e
collapsing waves for Hmo/Lpb0.0225 to plunging/
qgh2
h
spilling waves when Hmo/LpN0.0225. Physically, the
39
1=4VtanaV1=1
for
data indicate that nonbreaking/surging/collapsing
waves need more wave momentum flux than
plunging/spilling waves to achieve the same 2%
Plunging/spilling waves (Hmo/LpN0.0225):
run-up level on the same slope and water depth. At
!1=2
Ru2%
MF
slopes of tana=1/4 and milder, which includes all of
4:4tana0:7
Mase's data, there was no differentiation based on
qgh2
h
wave steepness. This implies that most of the
40
1=5VtanaV2=3
for
irregular waves were breaking as plunging or spilling
waves on the milder slopes.
Plunging/spilling waves (any value of Hmo/Lp):
The irregular wave run-up data from Ahrens were
!1=2
separated into two groups according to the steepness
Ru2%
MF
4:4tana0:7
criterion H mo/L p=0.0225. Mase's data were all
qgh2
h
assumed to represent breaking waves. The data were
41
then further divided into groups according to slope
1=30VtanaV1=5
for
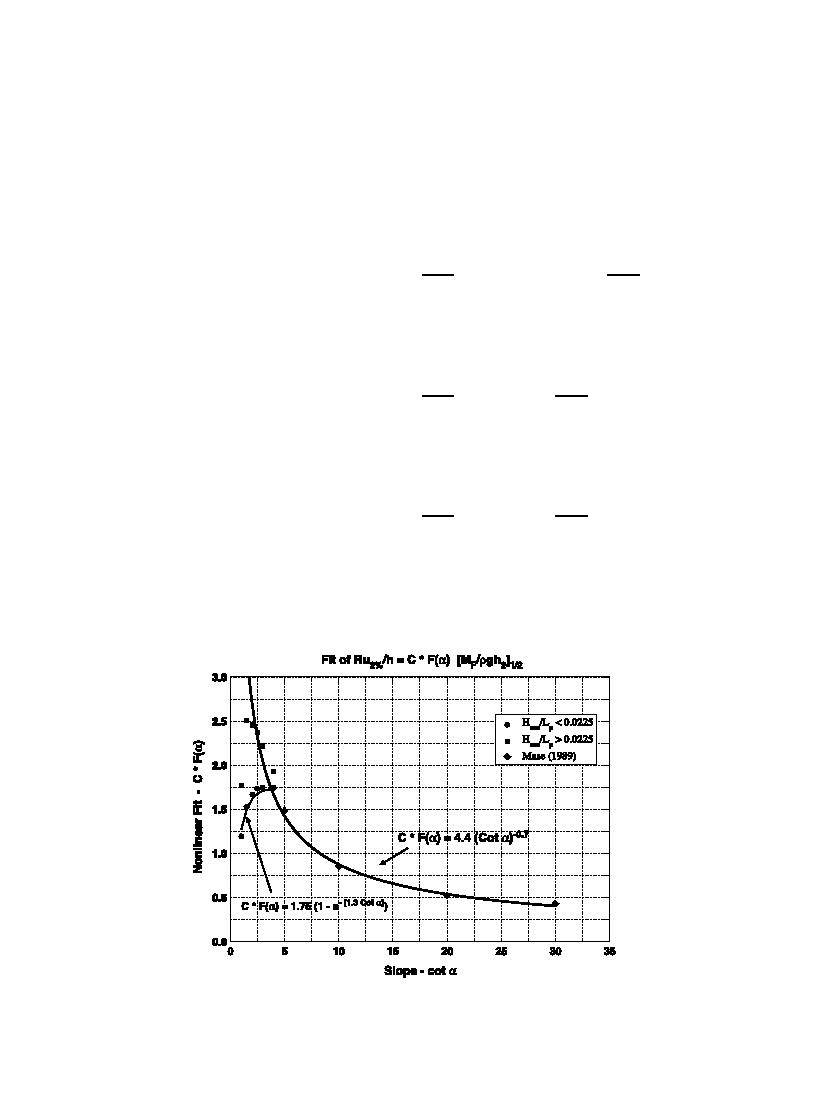
so that a best-fit expression for the slope function
Data for slope cota=1.01 and Hmo/LpN0.0225
CF(a) in Eq. (37) could be determined. The best-fit
did not follow the trend found for the other slopes,
points for each slope, and the resulting slope functions
Fig. 8. Empirical slope functions for breaking and nonbreaking irregular wave run-up.


 Previous Page
