

S.A. Hughes / Coastal Engineering 51 (2004) 10851104
1099
For a given value of the solitary wave parameter H/
h, maximum wave run-up increases for breaking
waves as the run-up slope increases. However, when
the slope becomes so steep that the waves no longer
break, further slope steepening results in decreasing
values of run-up. The transition relative wave height
between breaking and nonbreaking waves was given
by Synolakis (1986) as
H
0:8183cota10=9
42
h
break
Because of the difference in run-up behavior between
breaking and nonbreaking solitary waves, each case is
considered separately.
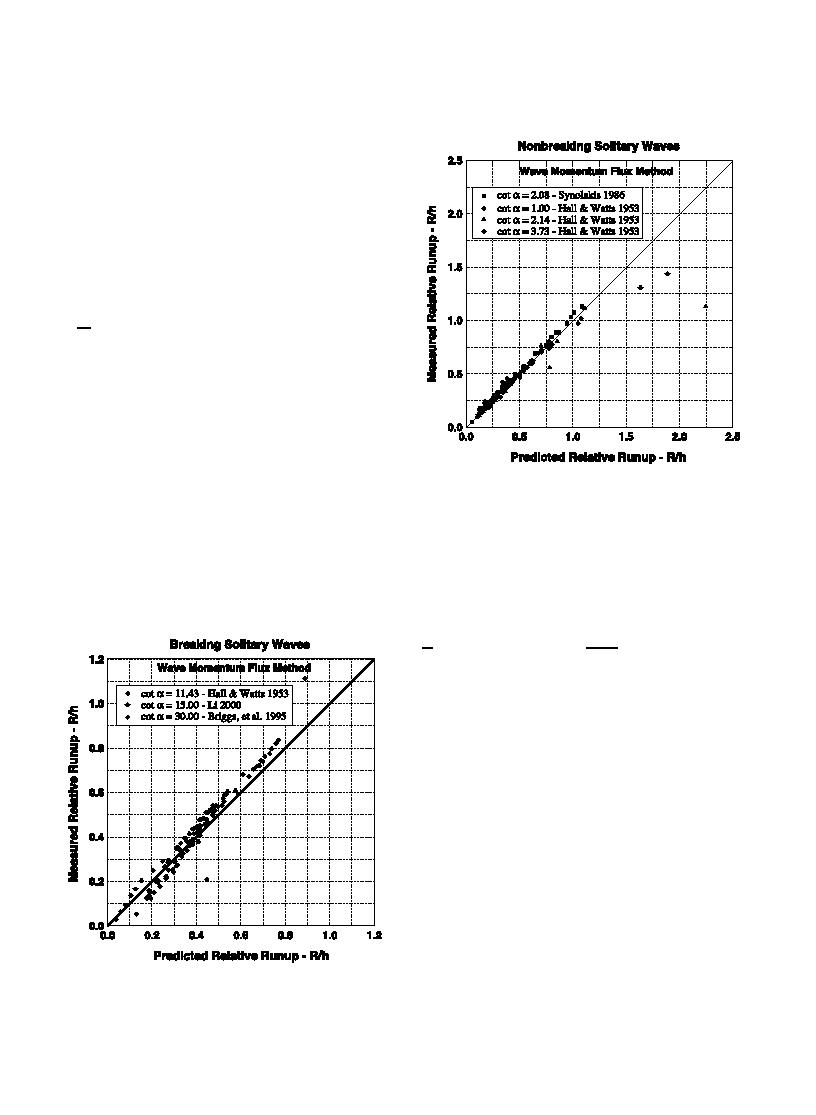
3.4.1. Breaking solitary wave run-up
Measured values of maximum solitary wave run-
up for slopes with cota=11.43, 15.0 and 30.0 were
Fig. 12. Measured versus predicted nonbreaking solitary wave run-
obtained from Hall and Watts (1953), Li (2000) and
up--Eq. (44).
values of the wave momentum flux parameter for
solitary waves were calculated for all the data. For
coefficients were then expressed as a function of slope
each structure slope an empirical coefficient was
resulting in the following simple equation for break-
determined that provided a best fit of Eq. (37). The
ing solitary wave run-up.
MF 1=2
R
1:39 0:027 cota
43
qgh2
h
versus run-up predicted by Eq. (43). The solid line is
the line of equivalence and the overall root-mean-
squared error was 0.051. There is reasonable corre-
spondence between estimates and observations, but
that was expected because the same data were used to
establish the predictive equation. More importantly,
there is a bias to the comparison because the simple
derivation resulted in the wave momentum flux
parameter being raised to the 1/2-power. The data
actually showed that a better fit could be obtained if
the exponent varied from 1/2 for very mild slopes up
to a value of unity near the transition between
breaking and nonbreaking waves. This implies that
the sea surface of the run-up wedge changes from a
nearly straight line to a concave shape as the structure
slope increases which agrees with run-up profiles
Fig. 11. Measured versus predicted breaking solitary wave run-up--
measured by Li and Raichlen (2001). Thus, the simple
Eq. (43).

 Previous Page
